Submitted by admin on September 25th, 2024

Evaluating the Long Legged Doji pattern in terms of the psychology of the financial market, the pattern consists of an equal struggle of bulls and bears. In most cases during the formation of the candlestick, the buyers and sellers have equal force and this makes the opening and closing price almost equal.
This state of affairs suggest that the forces at play are unsure of the direction that the security is likely to take. The Long Legged Doji, like most Doji patterns, gives a market indication that the current trend may experience a brief pause and might be followed by a reversal or a continuation signal depending on the movement of price of the security.
Long Legged Doji Candlestick Pattern – Trading Ideas
As understood from above example, after the formation of the pattern one can enter a position based on the confirmation candle.
Long Position
Entry: Specifically, a long legged doji pattern occurs after the market fluctuates to form a pin bar and the upper and lower parts of which closes almost at the same level upon the opening of the following candle; if the latter closes above the whole pattern, a long position can be taken.
Stop loss: For the long position entry can be taken at the low of the long legged doji pattern formed and the stop loss can also be placed at the low.
Profit Target: The profit must be decided based on the close resistance levels or come from the risk-reward ratio.
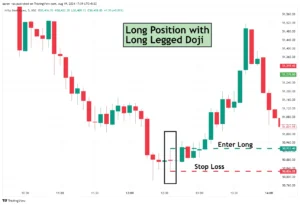
Referring to the chart of the State Bank of India in above part, we could identify that the pattern of Long Legged Doji candlestick pattern is framed in an uptrend. As you will understand from this article, after the formation of the pattern, the price continued with the trend.
At the time of forming this pattern, a trader could have gone long when the price of the stock opened above Rs. 838.40 besides the stop loss was at Rs. 836.
Short Position
Entry: Once the formation of long legged doji pattern has been identified, the next candle if it is bearish and is closing below the two lines of this pattern then a short position should be taken.
Stop loss: For the short position, it can be placed at the high of the long legged doji pattern formed.
Profit Target: The profit target can be set based on nearby support levels, or by using a predetermined risk-reward ratio.
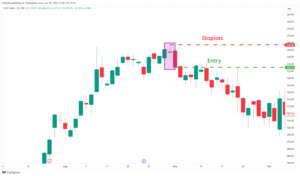
Now in the above formation of ICICI Bank, we can find the Long legged Doji pattern in the up-trend. Referring to the details highlighted in this article, it is clear that there was a change in trend in the price once this pattern was completed.
Like in the formation of this pattern a trader could have short likes when the price traded below Rs. 1144.25 with a stop loss of Rs. 1147.25.
Also read…
Style features to confirm the pattern
Consider the following criteria when identifying and confirming a long-legged Doji pattern:
Conclusion
The Doji with long upper and lower shadows covers long-legged variant and can help traders identify times of mixed market signals. When understood together with other technical analysis, psychology hence enables the traders to better in their decision making regarding the potential price actions.
Bear in mind however that the long-legged Doji pattern is an effective signal it should not be used alone. Trend analysis and support and resistance levels and any other technical indicator is a confirmation trade at all times.
Int Rates : 10.5% - 22%
Loan Amount: ₹ 1,00,000.00
Maximum Tenure - 7 Years
Lowest EMI : ₹ 1,686
Interest Rate 13.99% - 24.99%
Loan Amount: ₹ 1,00,000.00
Maximum Tenure – 5 Years
Lowest EMI : ₹ 2,326
Interest Rate 9% - 13%
Loan Amount: ₹ 1,00,000.00
Maximum Tenure – 20 Years
Lowest EMI : ₹ 1,014
Interest Rate 8.40% - 12%
Loan Amount : ₹ 1,00,000.00
Maximum Tenure – 35 Years
Lowest EMI – ₹ 739